Monday, 9 March 2015

Week 8 - Looking ahead

Well i've finally reached the last week of the course and this weeks theme is looking ahead. 

Anthroposcene

The Anthropocene is an informal geologic chronological term for the proposed epoch that began when human activities had a significant global impact on the Earth's ecosystems.
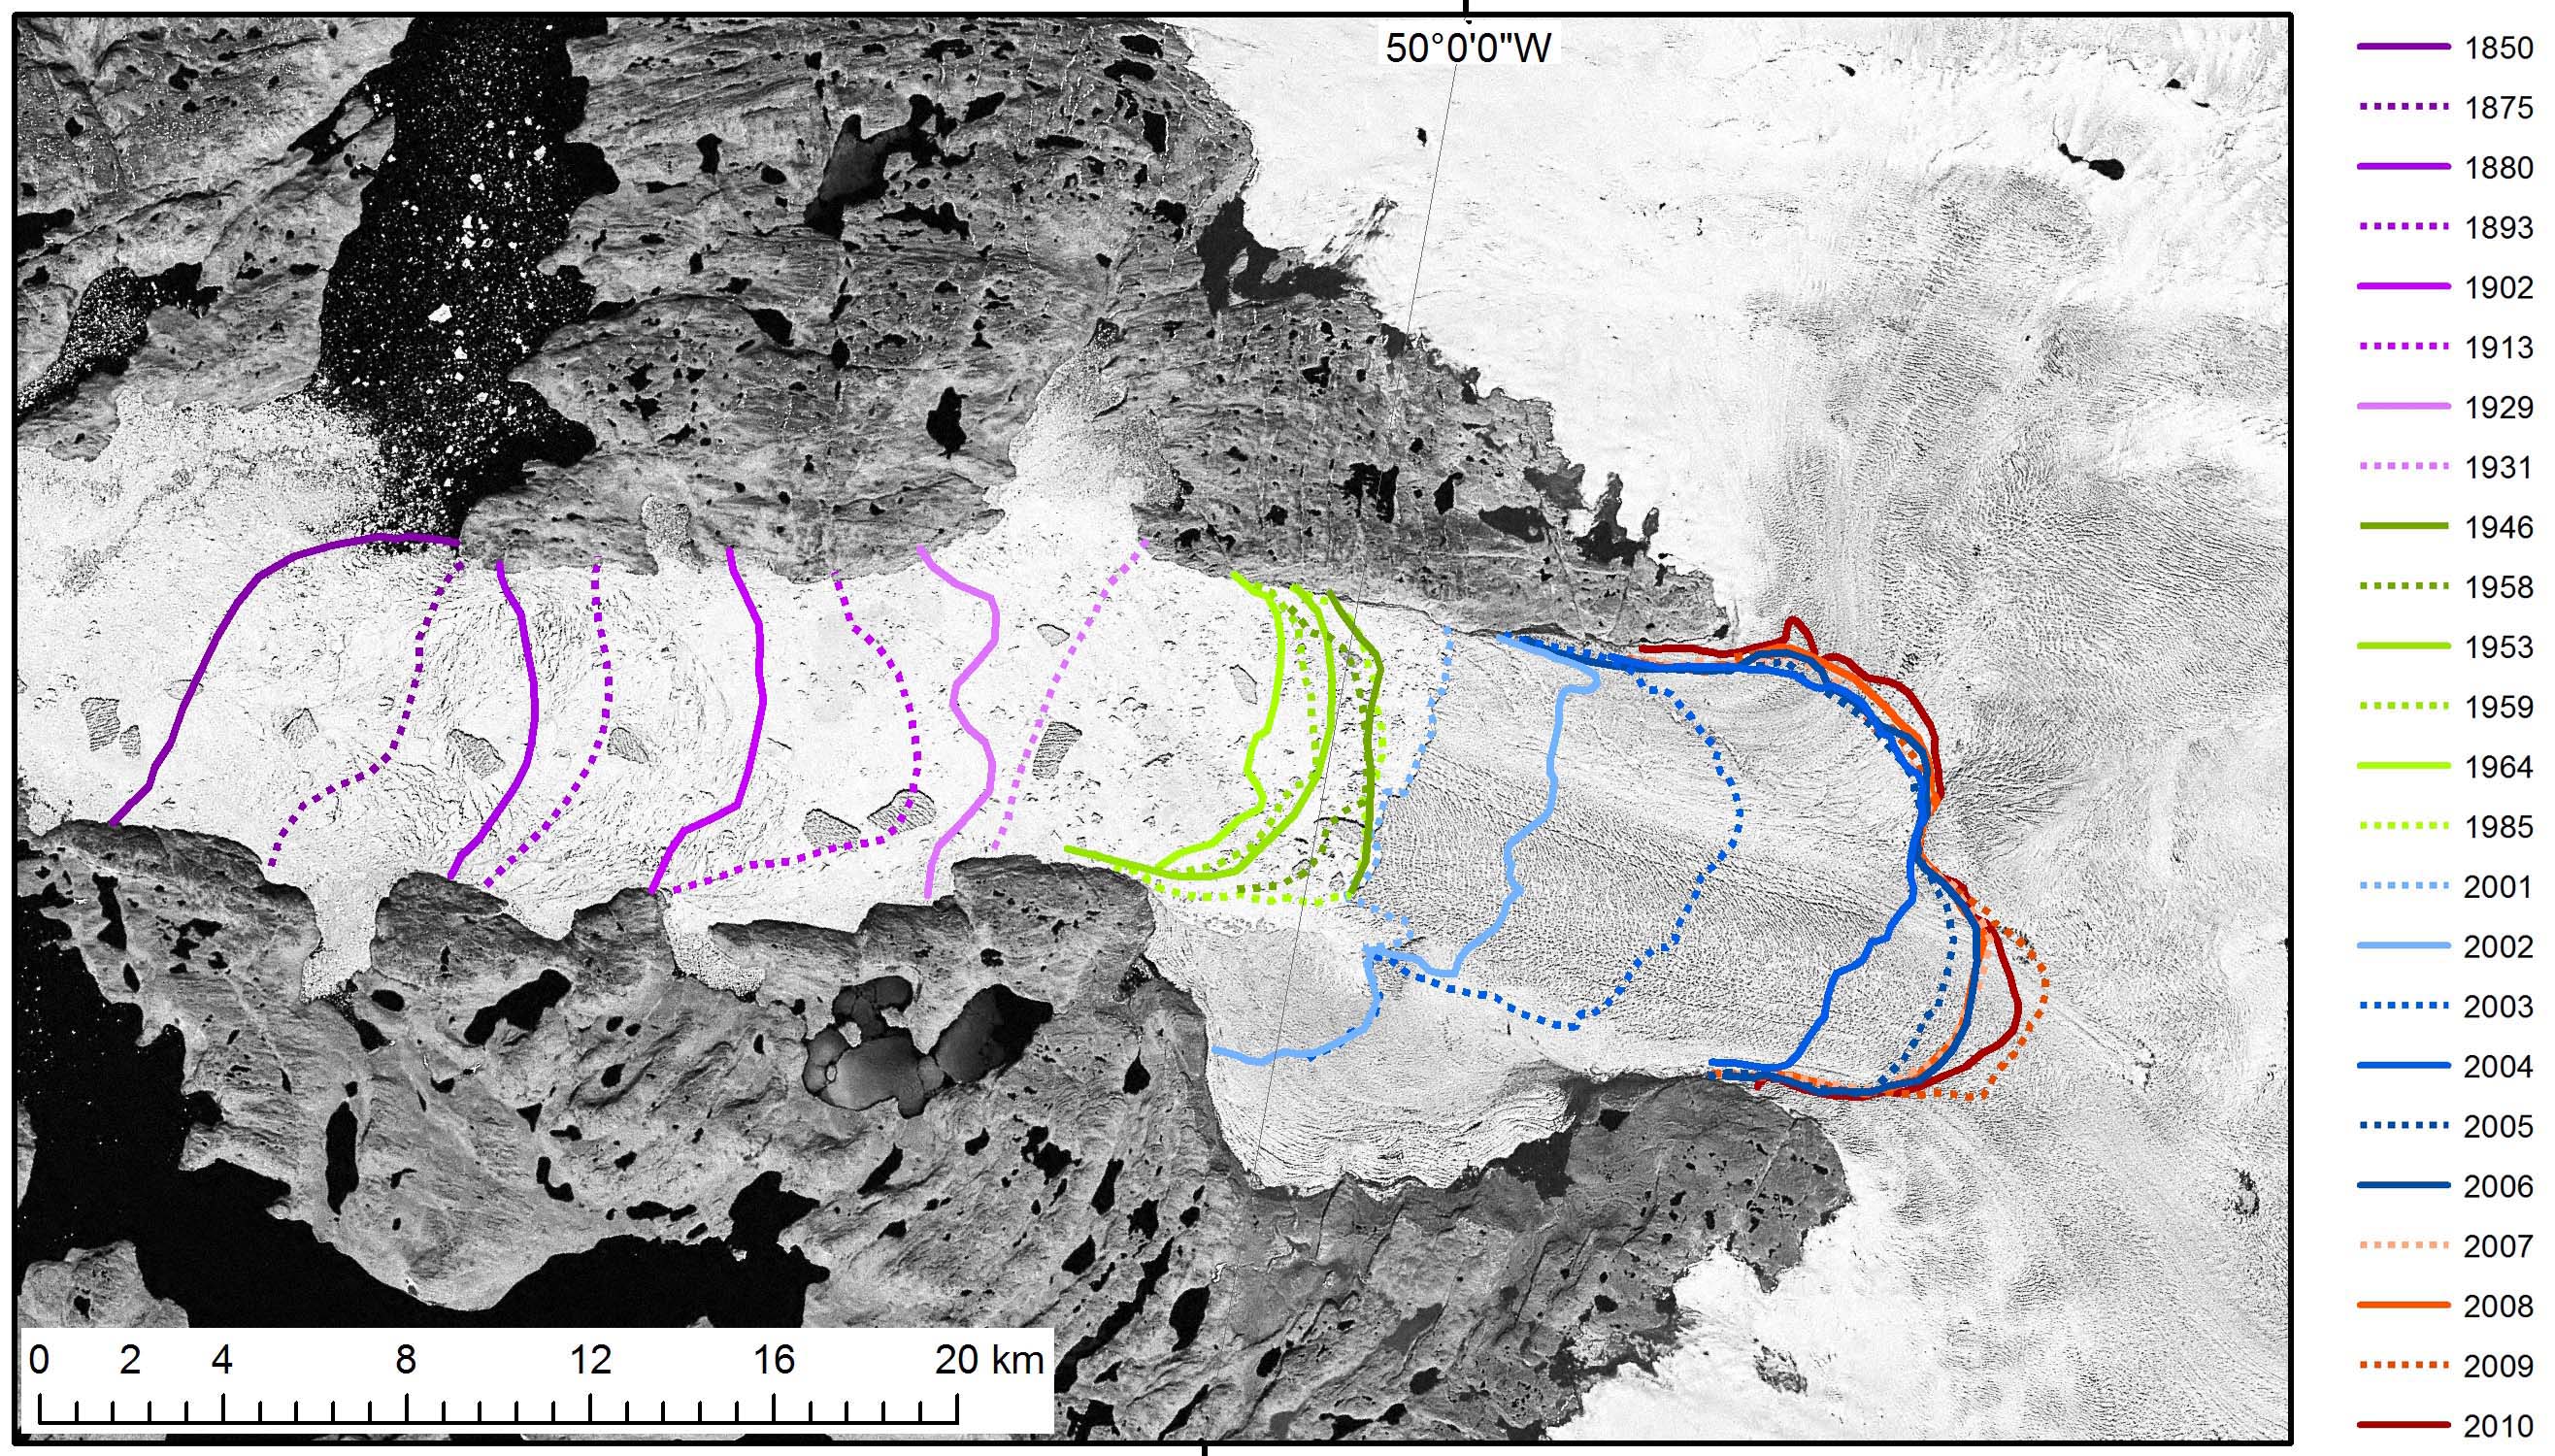
What will the climate be like in 1000 years when fossil fuels have all been burnt away? We recently reached a milestone in the levels of carbon dioxide in out atmosphere. In May of 2013, we reached 400 parts per million. If we continue to burn the known 4,000 billion tonnes of fossil fuels, then we expect carbon dioxide levels to rise to 1,500 parts per million around the year 2300.  Temperatures are set to increase in the next century by 8 degrees. If we burn the known fossil fuels, we will enter a persistent hot state that will prevent ice ages for hundreds of thousands of years which is the new Anthroposcene epoch. We will see sea levels could rise by tens of metres, new shallow seas inundating the low-lying parts of the world and a distinctive new layer of sedimentary rocks being deposited in them. 

How have we impacted the landscape? Since the pre-historic era humans have used stone for implements and began to excavate soil and rock. An estimated 57 000 million tonnes of earth and rock is shifted annually by humans, whereas only 22 000 million tonnes of sediment is annually transported by our rivers and oceans. The rate and amount of sediment moved correlates with increasing population. The earliest signs of the Anthroposcene era was in the Neolithic period when humans moved from hunter gatherers to farming and settlement. The beginning of the Antrhoposcene is general regarded to have started in the 1800s. 


Action

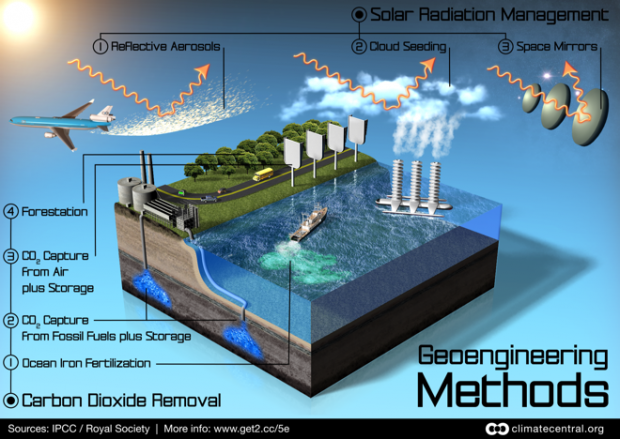
As our understanding of carbon emissions improves we also find better ways in which we can modify our actions to get the best results.

In 1997, the Kyoto Protocol committed industrialised nations to reduce their carbon emissions. But the protocol expires in 2020, and the United Nations are working on a new agreement to keep climate change within safe levels of less than two degrees of global warming above the pre-industrial level. To achieve this globally we will need to reduce the carbon emissions by 60% but this is pretty hard to do when developing countries are still trying to industrialise so developed nations need to work even harder.

Acting globally is hard to get results to meet the targets we set so they way forward is to get everyone to act locally and this cumulative approach will make it easier to reach the targets.
  1. "Think globallyact locally" or "Think globalact local" has been used in various contexts, including planning, environment, education, mathematics, and business.


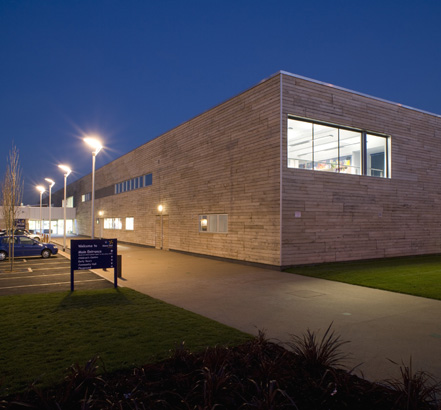
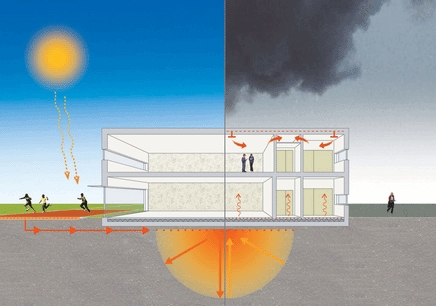
Understanding your carbon footprint and what you can do in your own home.

There are a variety of ways that you can reduce your carbon footprint at home, these include:


  • Energy saving lighting
  • Insulation
  • Efficient heating and hot water methods
  • Electrical appliances with efficient energy consumption
  • Swithing off lights and taking electrical items off standby
  • Savinf water
  • Using smart meters
  • Using public transport or taking less car journeys


Carbon footprint

  1. carbon footprint is historically defined as "the total sets of greenhouse gas emissions caused by an organization, event, product or person." The total carbon footprintcannot be calculated because of the large amount of data required and the fact that carbon dioxide can be produced by natural occurrences.
I took the carbon footprint test on the WWF website and it says that it would take 1.98 planets if everyone lived the same way as me. Oh blimey! I certainly didn't think that I was as bad as that. I'm vegetarian, work at home on occasion or drive  to the next town for work ( I have to drive as I have a lot of kit and and a category 1 responder), I walk wherever I can, don't buy a lot of shopping goods/electrical items etc, I use charity shops and free book shops. But I am now going to receive tips to help me reduce my carbon footprint.


http://www.sustainablebabysteps.com/think-global-act-local.html
http://www.energysavingtrust.org.uk
http://www.newscientist.com/article/mg22029371.700-the-future-of-the-climate-is-still-in-our-hands.html#.VP3i2inA5je
http://footprint.wwf.org.uk/home

Week 7 - Solutions


Solutions to climate change.....  


Mitigation

Carbon emissions are a critical factor in the changing of our climate but how can we reduce these:

Use less energy

The world's primary energy consumption is 470 exajoules, which is every person, on average, is using over two kilowatts of power all day, every day. We can all reduce the amount of energy we use by switching off lights, insulating our houses and not wasting energy etc.

Use renewables

Move away from fossil fuels and use renewables instead such as wind, solar and tidal.
In the UK, renewable energy makes up around 11% of our generation capacity.


Adaption

Climate change is happening anyway as we have already pumped a lot of carbon dioxide into the atmosphere since the industrial revolution so we will need to adapt out build environments to cope with warmer temperatures, more extreme weather and changes in rainfall.

Design for comfort

Keeping cool inside - Hotter summers will affect the design of buildings the most. The thresholds of comfortable heat are 25 degrees C for bedrooms and 28 degrees C in other living areas. The key is to maximise comfort with minimal energy use which can be done through passive cooling or energy efficient active cooling systems. To cope with the warmer summer climate, technologies and techniques include:


• shading systems for both new build and the existing stock that could be progressively rolled out as circumstances change
• glazing and film technologies to improve the performance of glass in terms of solar exclusion
• the development of reflective solid materials to reflect heat off of building surfaces
• secure night-time ventilation systems to allow buildings to be purged of hot air whilst also excluding insects
• acoustically attenuated natural and mechanical ventilation systems to cope with conditions where external/internal noise is a problem
• more efficient cooling systems, exploiting building-based renewable technologies and/or improved groundwater and earth-coupled cooling systems
• improved cooling control systems to maintain comfortable conditions without using excessive energy
• affordable, safe, phase change materials to provide the performance of thermal mass without the weight associated with conventional materials – this is particularly relevant for prefabricated buildings, which tend to be lightweight. 

Keeping cool outside

  • increasing shade
  • Plant for drier summers using different plants or better irrigation methods
  • increasing green spaces (parks and gardens) and blue spaces (rivers, ponds, lakes etc)

Keeping warm

  • high levels of insulation
  • creating a better system for hot water and space heating
  • mechanical ventilation with heat recovery

Construction

We need to review the materials, techniques and fixings of our buildings to ensure they can withstand the extreme weather conditions.

  • Ensure foundations are designed for the lifetime of the building
  • underground pipework can withstand soil and stability changes
  • better weatherproofing from driving rain and flood waters
  • above ground stability improved
  • using better materials that will last longer and take the impact

Managing Water


With the prospect of summer droughts, more frequent extreme rainfall and increased flooding, water management is becoming a serious challenge for the building industry.

Water conservation - Drinking water is increasingly becoming in short supply. Households will need to use systems so that rain water or grey water can be used for non potable uses. Creating water bodies within blue amenity areas to store or treat surface water.

Drainage - Larger capacity gutters, down pipes and drainage systems may be needed. Drains may be overwhelmed by heavy rainfall. Foul sewers may fail to function as we use less water.

Flooding - SUDS are a requirement of all new developments but these will need to be reviewed considering the soils ability to absorb and disperse surface water. Flash flooding and changing groundwater levels need to be considered in urban design.


Case Study


Example of a local building which has been constructed to cope with climate change.
Howe Dell School in Hatfield, Hertfordshire, UK


  • a pioneering heating, cooling and ventilation system which captures renewable energy to warm or cool the building
  • a wind turbine
  • electricity producing photovoltaic panels
  • roof lights and light wells which allow natural daylight to flood into the building, minimising the need for artificial lighting
  • high-performance windows to reduce heat loss
  • classroom sink tops and splash backs made from recycled yogurt pots
  • 'living' sedum roof areas which help to insulate the building and promote bio-diversity
  • a water recycling system


Howe Dell is Hertfordshire’s first ‘Eco-School’.  It is also the first building in the world to feature a revolutionary new heating system that uses the school playground to heat and cool its buildings. It also has many other eco features such as:


NIMBY conflicts


Renewable energy is being used to decarbonise the energy grid but there are issues when it comes to the technology and structures used to harness this energy.
The Not In My Back Yard (NIMBY) refers to those people who do not want these things in their local area or back yard as it's often referred to...they'd totally rather it be in someones's backyard tho!

Not my backyard? Is this really the problem when it comes to wind farms, surely they are miles away from peoples homes? However, even though off shore wind farms are not located in peoples back yard they are still receiving protests when new schemes for farms are being planned and getting complaints about existing farms.

There are two key things to understand about NIMBYism:
1) Procedural justice - issues of how people are told, and when they're told, and how much they're told, and how much of a say they have in any decision-making or governance process
2) Place attachement - refers to the kinds of emotional bonds that can develop between individuals and communities, and the particular places or landscapes or seascapes in which they live, and which are important to them.

Community benefits protocol

Community benefits schemes are a well established, integral part of onshore wind energy development, and represent a positive relationship between developers and communities.

With the aim of formalising the industry’s approach, RenewableUK first launched its Community Benefits Protocol in February 2011. As an industry led and government backed initiative, this protocol was the first of its kind to provide clear industry-wide commitments on community benefit provision. This Protocol was further updated in October 2013 in response to the DECC call for evidence into onshore wind, which concluded in June 2013. This Protocol is supported by DECC and a range of governmental and community stakeholders.
Under the Protocol, developers in England with qualifying projects commit to provide community benefits of £5,000 per MW of installed capacity, or equivalent benefits-in-kind, directly to host communities.
These funds can be used to finance anything the community deems appropriate and necessary for their areas, including community owned renewable energy projects, village halls, recreational facilities or equipment for local schools. Benefits under the Protocol are negotiated directly with host communities.


links:
http://www.arcc-network.org.uk/wordpress/wp-content/D4FC/01_Design-for-Future-Climate-Bill-Gething-report.pdf
http://www.theguardian.com/science/2013/nov/28/drink-local-the-climate-change-act-in-the-lake-district-rebecca-willis
http://www.renewableuk.com/en/renewable-energy/communities-and-energy/community-benefits-protocol/index.cfm

Saturday, 28 February 2015

Week 6 - Impacts on human systems

Last week was pretty hard to understand as a lot of the glacier information was hard to work out and ocean acidification was new to me, so there was a lot going on to fill up my brain. Impacts on the human environment and systems is more connected to what we see everyday and links in with studies I did at university back in 2000...


Impacts on human systems

In the UK, the building industry is responsible for over 50% of carbon emissions, and in some economically-developed countries, the figure is even higher. There are 3 concepts:

Urban heat islands

This was first discovered by the large expanse of buildings in our urban areas are very efficient at absorbing and reflecting heat. The larger and taller the buildings, the more heat they are capable of trapping at street level bouncing backwards and forwards between buildings. Buildings block wind, which inhibits cooling by convection and increased drainage of urban areas, sewers carry away water, preventing evaporation.


Heat islands are not a newly-discovered phenomenon. Indeed, using simple mercury thermometers, weather watchers have noticed for some two centuries that cities tend to be warmer than surrounding rural areas. The island is affected but the size of the city, population, number of building etc.


Heat waves

A heat wave is a period of hot weather prolonged over several days. In 2003 almost 70, 000 people died in Europe due to the hot weather either from hyperthermia, dehydration and heat stroke. A large proportion of people also died at the top floor of high rise building which can be linked to the concept of thermal comfort.


Thermal comfort

Your body is producing approximately 100 watts of heat even just sitting down and this amount increases as you become more active.  As you get hotter you adjust your environment such as remove layers of clothes, open a window, fan cold air on you or perspire. The rate of heat loss depends on the environmental conditions, temperature, humidity, and air movement.


Climate change and food security

The global population stands at 7 billion. We predict by 2050, we will reach 9.2 billion people on this planet. 86% of these people will be living in less economically developed countries so the challenge is how we will feed everyone! The four staple foods are rice, maize, wheat and potatoes. These provide essential carbohydrates in our diet with rice being the most important because it provides the main daily calorie intake for 50% of the world's population. Because of the growing population we need to ensure that food production doubles by 2050 and we need to ensure there is a secure system for this to happen.

There are a number of factors which are affecting food production/crops, which are largely due to climate change. These include drought, changing rainfall patterns, flooding, fires and crop diseases.


Crop disease

Since the 1960s, we've undergone what is termed the Green Revolution. 
  1. The Green Revolution refers to a series of research, and development, and technology transfer initiatives, occurring between the 1940s and the late 1960s, that increased agricultural production worldwide, particularly in the developing world, beginning most markedly in the late 1960s.
The Green Revolution haas meant the increased use of fertilisers, herbicides, pesticides, and fungicides, as well as greater farm mechanisation and intensification. It has also meant the introduction of high yielding varieties of our crops in vast hectarages of monocultures. If pathogens are introduced to these monoculture environments they can wipe out an entire crop in one go. Examples of this happening are:
Ash dieback fungus
Irish potato famine

Fungi is becoming a big problem pathogen and there are strains of fungi which are affecting our staple food supply (rice/wheat/maize). And the cost of loss of crop caused by these fungi to the global economy is $60 billion US per annum. There is a gradual shift of pathogens affecting crops towards the higher latitudes. Since 1960 the mean shift has been in the region of three kilometres per year. Fungi are moving over 7 kilometres per year polewards in a warming world.


Reflection:

What are the most important themes you have learned this week?

Food security - i'd never hear of this before and seems like it's a pretty big thing which we really need to look out on a global scale. It's shocking how much we are producing and wasting whilst people in other countries are starving

What aspect of this week did you find difficult?

Nothing too bad this week, I suppose i didn't initially get some of the stuff mentioned on the video for food security but once i read the transcript and read other articles it made more sense

What did you find most interesting? And why?

The heat wave stuff and how the urban environment is affected.

Was there something that you learned this week that prompted you to do your own research?

Food security - looked at some news articles to strengthen my understanding and out things in perspective

Are there any web sites or other online resource that you found particularly useful in furthering your knowledge and understanding?

http://www.nasa.gov/topics/earth/features/heat-island-sprawl.html
http://earthobservatory.nasa.gov/IOTD/view.php?id=36227
http://www.theguardian.com/environment/2012/sep/19/climate-change-affect-food-production
http://www.foodsecurity.ac.uk/index.html

Tuesday, 24 February 2015

Week 5 - Impacts on natural systems

OK a week late to week 5 with a lot of other learners onto week 6 already but life does get in the ways sometimes but i'm determined to crack on catch up...

Last week was all about Future Projections and modelling and this week is all about the impact of climate change on natural systems.

Impact on land systems - The Cryosphere

  1. Frozen water is found on the Earth's surface primarily as snow cover, freshwater ice in lakes and rivers, sea ice, glaciers, ice sheets, and frozen ground and permafrost (permanently frozen ground). The residence time of water in each of these cryospheric sub-systems varies widely.
As the earth warms sea levels are set to rise and this is currently due to thermal expansion of the oceans as well as melting mountain glaciers and small ice caps. However, Greenland and Antarctica could also be contributors as they currently make up 99% of the worlds glacier ice on earth. Which equates to 65 meters of sea level rise.


Greenland

Greenland has shown a rapid response to global warming over the last 2 decades. Ice loss have increased as well as glaciers speeding up and thinning. Half the mass loss is due to surface melt and the other is due to carving - blocks of ice brewing off into icebergs into the sea. 

In summer, half of Greenlands ice sheet melts naturally. In 2012, the melt extent was the largest in the satellite era, extending up to 97% of the ice sheet surface and lasting two months longer than the 1979 to 2011 mean. As well as ice melt, a lot of the mass loss has been due to ice flowing to the margins and breaking off into icebergs, meltwater draining to the bed (basal lubrication) or forming lakes on the surface. If lakes are formed then these will absorb solar radiation and heat the ice surrounding it causing it to melt further.


Greenland at Jakobshavns Isbrae. The image below shows the retreat of the ice tongue (An ice tongue is a long and narrow sheet of ice projecting out from the coastline. An ice tongue forms when a valley glacier moves very rapidly out into the ocean or a lake). Over the years the tongue has been retreating. The ice tongue acts as a buttress for the main ice sheet and with the break up of the tongue the ice sheet will advance and spread towards the sea, thinning, melting and and breaking off. With the changes in the ice sheet this will also effect the reflection of solar radiation (albedo effect).


Antartica

Antartica has many ice shelves that buttress the main ice sheet. The West Antarctic ice sheet is much more unstable than the East as most of the sheet lies beneath sea level making it a marine ice sheet. 

Taken from antarticglaciers.org: The Marine Ice Sheet Instability hypothesis is that atmospheric and oceanic warming could result in increased melting and recession at the grounding line on a reverse slope gradient. This would result in the glacier becoming grounded in deeper water and a greater ice thickness. This is because the grounding line in this region has a reverse-bed gradient, becoming deeper inland.  Stable grounding lines cannot be located on upward-sloping portions of seafloor[13]. Ice thickness at the grounding line is a key factor in controlling flux across the grounding line[3], so thicker ice grounded in deeper water would result in floatation, basal melting, increased iceberg production, and further retreat within a positive feedback loop. This would result in a rapid melting of the West Antarctic Ice Sheet, triggering rapid sea level rise.


As i'm behind on the course (2 weeks) i've had to copy and paste the information from the transcript to cover this :(


Ocean acidification


The oceans cover 70% of the planet's surface. But because they're deep, they actually contain 99% of the living space for animals on our planet. So they contain a large proportion of the global biodiversity. The ocean plays a really important role in the carbon cycle. Carbon dioxide is really soluble in sea water. And the ocean actually absorbs about a third of that atmospheric carbon dioxide. As it dissolves into the sea water, it causes a series of chemical reactions, which is now leading to ocean acidification. As carbon dioxide dissolves into sea water, it reacts with water to form carbonic acid. This carbonic acid is really unstable, and quickly dissociates into two irons, bicarbonate, and hydrogen ions. And it's the concentration of hydrogen ions in seawater that determine its pH. The pH of seawater at the moment is about 8.1.


Since the Industrial Revolution, the pH of the ocean has fallen by about 0.1 of a pH unit. If we continue to release carbon dioxide into our atmospheres, at the rates that we're predicting at the moment, we're looking at a pH change of about 0.3 to 0.4 of a pH unit by the end of this century.

Ocean acidification affects:


  • Increased carbon dioxide levels in seawater has the potential to alter the basic physiology of any marine organism 
  • The reproduction process of marine invertebrates
  • Acidification reacting with pollution in the oceans


Reflection


What are the most important themes you have learned this week?
Lots about glaciers and lots about ocean acidification - they are really affected by climate change

What aspect of this week did you find difficult. 
A lot of it - I found the glaciers and the ocean acidification hard - slightly out of my depth but this is because I also didn't have time to concentrate as much this week

What did you find most interesting? And why?

One in every three breaths that we take comes from oxygen produced by phytoplankton living in the oceans.  What a fact... I would have never of guessed that. pretty fascinating.


Was there something that you learned this week that prompted you to do your own research?
Looking up about the changes in Greenland and what the ice sheet and the ice tongue actually looked like

Are there any web sites or other online resource that you found particularly useful in furthering your knowledge and understanding?
See below:
http://polarportal.dk/en/groenlands-indlandsis/nbsp/isens-overflade/
http://www.antarcticglaciers.org/glaciers-and-climate/ice-ocean-interactions/marine-ice-sheets/
http://explore.glacierworks.org/en
http://www.whoi.edu/OCB-OA/FAQs
https://www.youtube.com/watch?v=5cqCvcX7buo&feature=youtu.be


Tuesday, 10 February 2015

Week 4 - Future Projections

Back to the grindstone this week, I have the whole weekend to go through this weeks course so I should have some better notes...


Making future projections and modelling future scenarios


The MET office are the worlds leading centre for climate modelling and prediction (as well as them primarily being the UK's weather forecaster) because the processes that you need to use to predict climate change are the same as weather prediction but instead of looking at the short term they need to look at the longer term - 250 years for a climate simulation. There are additional elements which need to be included in the models such the tidal changes, carbon trapped in vegetation etc but the ideas are the same.

2 million calculations are needed at every step, which is every 20 minutes. There are many equations that are required and some of these are already known such as the relationship between the atmosphere and the oceans but there are others which need to worked out along the way. You need a super computer to work all these calculations out and it takes 3 months to do...wow!

Why should be trust these models? We feed the model with information; natural factors such as sun variance and volcanic eruptions as well as human factors with the increase in CO2 with deforestation and burning of fossil fuels. If the models are run with just the natural factors all is correct until 1970 but after that it shows the climate getting cooler, once the human factors are added then the models therefore gives us confidence that its right. This modelling is called Fingerprinting which has allowed the IPPC to state that 90% chance that the climate warming is from the effect of human activities.

Climate models predict that the earths temperature will increase by about 2-6 degrees by the end of the 21st Century depending on how much the carbon emissions grow by.


Climate feedback systems can more the double the effect caused by carbon emissions. These feedbacks include: water vapour, clouds, snow and ice and the carbon cycle.
CO2 emissions will vary in the future and it is hard to predict what will happen in terms of technology changes and population growth.

It takes decades to centuries for Earth to fully react to increases in greenhouse gases. Carbon dioxide, among other greenhouse gases, will remain in the atmosphere long after emissions are reduced, contributing to continuing warming. 

These considerations mean that people won’t immediately see the impact of reduced greenhouse gas emissions. Even if greenhouse gas concentrations stabilized today, the planet would continue to warm by about 0.6°C over the next century because of greenhouses gases already in the atmosphere.


IPCC Fifth Assessment Report 2013 (AR5)

The Fifth Assessment Report (AR5) is the most comprehensive assessment of scientific knowledge on climate change since 2007 when the Fourth Assessment Report (AR4) was released. It was released in four parts between September 2013 and November 2014. AR5 is made up of the full reports prepared by theWorking Groups (I, II and III) and their Summaries for Policymakers as well as the Synthesis Report. 


A summary of the report included the following statements:

Warming of the climate system is unequivocal, and since the 1950s, many of the observed changes are unprecedented over decades to millennia. The atmosphere and ocean have warmed, the amounts of snow and ice have diminished, sea level has risen, and the concentrations of greenhouse gases have increased.

Total radiative forcing is positive, and has led to an uptake of energy by the climate system. The largest contribution to total radiative forcing is caused by the increase in the atmospheric concentration of CO2 since 1750.

Human influence on the climate system is clear. This is evident from the increasing greenhouse gas concentrations in the atmosphere, positive radiative forcing, observed warming, and understanding of the climate system.

Continued emissions of greenhouse gases will cause further warming and changes in all components of the climate system. Limiting climate change will require substantial and sustained reductions of greenhouse gas emissions. 

Geoengineeing 


Geoengineering it using technology to control the climate. It includes carbon dioxide removal, carbon capture. Methods for these are through bioenergy, carbon sequestration, iron fertilisation, atmospheric CO2 scrubbers, afforestation.


I checked out the space mirrors which were mentioned in the diagram and it's hard to believe we would consider such a method...but it's quite possible things may led to this eventually. Even the IPCC mentioned this as a possible method. Was well as space mirrors there are other ways to manage solar radiation, these include releasing "stratospheric aerosols"in the upper atmosphere and using earth-bound reflectors or urban roof reflectors.

An diagram showing what the best method to use is show below, as produced by the Royal Society.


There are pro's and con's whether we should be using these geoengineering methods. They are likely to cost a considerable amount and do they actually work and will they any negative impacts on the climate? Is carbon capture considered in the same way. I personally think we should concentrate on our activities and reduce our emissions and change they way we behave. Surely we are not even there at the moment with the continual use of fossil fuels as a primary source of fuel and the lack of alternative energy in our day to day lives. I wouldn't dismiss technology and believe that these geoengineering methods may need to be implemented but do I want to see balloons in the air, see space mirrors launched into the upper atmosphere and know that we are purposely releasing aerosols into the stratosphere before we even sort out our bad habits..of course not.


Reflection

  1. What are the most important themes you have learned this week? - Geoengineering.
  2. What aspect of this week did you find difficult? - trying to understand if the climate models can really help us out if there are so many variables
  3. What did you find most interesting? And why? - Geoengineering and the crazy ideas that are already being considered..seriously.
  4. Was there something that you learned this week that prompted you to do your own research? - just to look up what carbon capture was and what the different methods entailed
  5. Are there any web sites or other online resource that you found particularly useful in furthering your knowledge and understanding?

links


Tuesday, 3 February 2015

Week 3 - We are changing the climate!

So this is what we want to know. I know that we changing the climate but I want to know how we know we are changing the climate. If I have to go out in my day job and explain the negative impact peoples activities have on the climate then I want to have the ammunition to explain why, I suppose this is why I am doing the course. So lets crack on with it...

(Please note that this week is super busy so my notes and findings from the course are less comprehensive than usual)


Signs of Climate Change

Key indicators

Taking data from weather stations all over the world and working out the global average temperature, over the last century the temperature of the earth has significantly gone up in the last century and the last decade was the warmest. if you also look at the temperature of the ocean this follows the same trend.
year to year and decade to decase

Since 1880 there has been a steady rise in sea levels which is down to thermal expansion and melting of land ice (greenland ice sheet and glaciers. The melting of sea ice does not contribute to sea level rise, only the melting of land ice does.

The MET office scientists develop observational datasets which are used to monitor climate change. they create month climate bulletins to explain what's been happening in the worlds climate. The September 2014 monthly bulletin shows the temperature anomolies in comparison with the average temperatures between 1961-90, see below. 


The global temperature anomalies from the different months can be collated together to see how the climate is changing, such as in the graph below. This shows the best estimate of the global surface temperature but they are only estimates and the reality may slightly differ from these readings. The readings will fall in the shaded areas in 19 out of 20 cases.


Global surface temperatures have increased and the IPCC state "most of the observed increase in global average temperatures since the mid-20th century is very likely due to the observed increase in anthropogenic greenhouse gas concentrations."

There are issues with the causes at the beginning of the century as these may have been likely to be due to solar, volcanic and green house gas factors and the natural variability in the climate system. Other factors include El Niño, La Niña and volcanos eruptions such as like Mount Agung in 1963 and Mount Pinatubo in 1991.

El Niño, La Niña and ENSO (El Niño-Southern Oscillation) are terms that refer to a cycle that occurs naturally in the climate system in the Pacific ocean region of the world near the equator. The cycle involves both the ocean and the atmosphere and has wide-ranging effects. For example it can cause drought and famine in some of the areas that are affected. El Niño and La Niña are opposite states of the cycle. It is possible to see which state the cycle is in by looking at whether the water in the eastern Pacific is warmer or cooler than normal (which identifies El Niño or La Niña states respectively).

Extreme events

Scientists also keep careful records of all the extreme events and anomalies to see what areas of the world are sensitive to and if these events are increasing.The Climate.gov website tracks these events - below is a segment of the map of the extreme events around the globe.


There are very different activities happening in the Arctic and the Antarctic. In the Arctic (up the top) the sea ice extent is getting lower, each year the ice is becoming thinner, there are more gaps between the ice sheets and there is less older ice which can all be attributed to the warmer temperatures through climate change. The Antarctic sea ice on the other hand has reached record highs but this is because the warmer temperatures in the winter do not take the ice over zero but there are really strong winds, the 'westerlies,' which have gotten stronger in response to a stubbornly cold continent, and the warming ocean and land to the north.

Urgent Action report

American Geophysical Union is a union of scientists dedicated to enhance the understanding of geophysical science. The put a report together called Human-induced climate change requires urgent action. It came out in 2003 and has since been revised and re-affirmed with the latest update being 2013. The crux of the report explains that since the industrial revolution the level of carbon dioxide and other trapped greenhouse gases has increased, mainly through fossil fuel burning. Human-caused green house gases are responsible for the observed global average surface warming of almost 0.8 degrees celsius over the last 140 years. Natural process in the earths climatic systems cannot remove this level of green house gases quick enough so our past, present and future emissions will affect the climate for millennia.

They identify in the report that observations show large‐scale increases in air and sea temperatures, sea level, and atmospheric water vapor; they document decreases in the extent of mountain glaciers, snow cover, permafrost, and Arctic sea ice. With greater warming there will be risks to ecosystems and society such as increased extremes of heat, precipitation, and coastal high water, threats to public health, water availability, agricultural productivity, and coastal infrastructure. Biodiversity loss is expected to accelerate due to both climate change and acidification of the oceans, which is a direct result of increasing carbon dioxide levels.
 

Carbon cycles changes

Since 1750 when the steam engine was designed, economic development has been centred on the burning of fossil fuels. 10 petagrams of carbon (10 to the power of 16 gram of carbon) are released to the atmosphere every year due to human activities. 90% of the emission of CO2 comes from the burning of fossil fuel. The remaining 10% comes from deforestation.
 
Whilst the 10 petagrams are emitted each year, the atmospheric levels are only increasing by 4.5 pentagrams and this is because the ocean and land are absorbing them like a sink. If we didn't have  them there to absorb the CO2 then things would be a lot worse.
 
The current level of CO2 is 400ppm. USA has the highest carbon emissions per capita.
 
  1. What are the most important themes you have learned this week? - the importance of observations and measurements and looking at the bigger picture and not just current events.
  2. What aspect of this week did you find difficult? - How we work out what is happening with so many variations going on in the world and throughout time.
  3. What did you find most interesting? And why? - The maps of the extreme events and how different each country is and the effects from climate change.
  4. Was there something that you learned this week that prompted you to do your own research? - Yes, looked into rainfall around the world which spurred a question about rainfall differing in different parts of the world.
  5. Are there any web sites or other online resource that you found particularly useful in furthering your knowledge and understanding?
LINKS
http://www.metoffice.gov.uk/research/monitoring/climate
http://www.climate.gov/news-features/featured-images/state-climate-extreme-events
http://nsidc.org/news/newsroom/20121002_MinimumPR.html
http://sciencepolicy.agu.org/files/2013/07/AGU-Climate-Change-Position-Statement_August-2013.pdf


Sunday, 25 January 2015

Week 2 - Past Climate Change


Ok so i've now progressed into the second week of this course, got 14 out of 15 in the test...get in! I have made some connections and read other peoples blog etc so progress is being made. There are some really interesting people on this course who I can definitely learn from.

Past climate change

For 4.5 billion years the Earth has been self regulating and pretty much habitable for most of that time. Throughout these years there have been some positive and negative feedback loops which have impacted the Earths climate.


The ageing sun

As the sun gets older it gets hotter and hotter but luckily enough the Earth is located in the area around the sun which is neither too hot nor cold so is called the habitable zone. Either side of us is Mercury (nearest the sun) which is so hot is can melt lead, and on the other side (further away from the sun) is Mars which is frozen.


At the birth of our solar system, blooming ages ago, the sun was a good 30% brighter than it is now which would mean that the Earth would be 20 degrees cooler meaning it would have been frozen....but it wasn't. The reason for this is because the cuddly 'blanket' around the Earth was much thicker and contained a lot more CO2 then there is now which kept the Earth nice and warm and habitable. 

Nowadays the blanket is no longer as thick (which is pretty good as we would very toasty indeed) but the question is where has all the CO2 gone? This can be explained through chemical weathering. Chemical weathering is where carbon dioxide and rainwater forms a weak acid, carbonic acid, that dissolves silicate rocks. The carbon in the form of bicarbonate ions washes into the ocean, where it is used by many organisms to form their shells, which are then deposited on the ocean bed to form carbonate rocks.
  1. Carbonate rocks are a class of sedimentary rocks composed primarily of carbonateminerals. The two major types are limestone, which is composed of calcite or aragonite (different crystal forms of CaCO3) and dolostone, which is composed of the mineral dolomite (CaMg(CO3)2).

So the Earth self regulated itself through negative feedback - Sun got hotter, more chemical weathering occurred and the Earth stored more carbon which then reduced the amount in the blanket.

Snowball Earth


Another thing that happened over the course of these past 4.5 billions years has been 5 times occasions where it has got pretty cold which we call the Ice Ages, during these times there were still parts of the Earth that were not completely frozen. However, there was a time when the Earth did completely freeze over which is affectionately known as Snowball Earth.

Snowball earth describes the coldest global climate imaginable - a planet covered by glacial ice from pole to pole. The global mean temperature would be about -50°C (-74°F) because most of the Sun's (Solar) radiation would be reflected back to space by the icy surface.  The last snowball earth ended 635 million years ago (Ma), near the end of the Proterozoic Eon.  

Here is my interpretation of the Snowball Earth and the process of how it cam about. My 30 minute stab at creating something understandable with a vague artistic flare - definitely needs more work but it gives you that jist of things!


Understanding factors which cause climate change

There are a number of natural variations which contribute to changes in the Earths climate which fall into two categories; predictable and unpredictable.

Predictable
There are 3 predictable variations which are linked to the the way the Earth moves around the sun

  • Eccentricity - the Earth's orbit is changing from a circular one to a more elliptical
  • Obliquity - The tilt of the Earths axis varies
  • Precession - Where the Earth wobbles like a spinning top (over a period of 23,000 yrs)


Unpredictable
  • Volcanoes - eruptions cannot be planned and when they do they reduce the Earth's temperature but emitting aerosols into the atmosphere which reflect solar radiation back towards the sun
  • Solar variabilitythe change in the amount of radiation emitted by the Sun


Climate change records

In order to understand climate change and to reconstruct the past changes we need date. Unfortunately we have only been collecting instrumental data and making visual records in the short term (post 1600) but we need to know what happened prior to that. Current instrumental data includes weather stations, weather balloons, satellites, ocean monitoring and prior to that ships made diary entries which have been put onto databases.

How do we find data prior to 1600? Well this lies in proxy data which are preserved physical characteristics of the environment that can stand in for direct measurements. We can obtain proxy data from tree rings, ice cores, fossil pollen, ocean sediments, corals and historical data.

Tree rings

In the spring time, through photosynthesis trees begin to grow. Trees generally produce one ring per year. During a good year the tree grows faster and so lays down more tissue in the year, resulting in a wider growth ring. Poor conditions mean slower growth, less tissue laid down and consequently a narrower ring. 


Tree rings are a great way of seeing what the climate conditions were on Earth going back hundreds to thousands of years...depending on the tree of course. It is important to apply the principle of cross dating, a tree may have become affected by disease or may have consumed more nutrients if a nearby neighbour has died. So a number of trees in an area can be looked at as they will depict the same patterns over time. Scientists can also over lap existing tree rings with those from fallen trees from a similar area so they can gather information even further back in time.


What effect do Volcanoes have on climate change?


When a volcano erupts it emits lots of aerosols which suspend in the stratosphere and reflect solar radiation which therefore cools the Earth. The aerosols are suspended for approximately 1-2 years and they then fall to Earth. Their impact is short term but does have a considerable cooling effect.

As well as aerosols, volcanoes emit CO2 as well as other greenhouse gases which contribute to the blanket surrounding the Earth which warm it up. These remain in the atmosphere for a longer time so after the cooling will contribute to the warming of the Earth again.


Reflection from this weeks course

  • What are the most important themes you have learned this week?
Snowball Earth, proxy data and volcanoes
  • What aspect of this week did you find difficult?
Understanding the ever changing climate changing and where we fit in to the changes today. It's pretty hard to understand that the Earth warms and cools due to lots of natural variations and then think that we will be the cause of it warming further, especially as people post youtube videos which argue against it.
  • What did you find most interesting? And why?
Snowball Earth and how the Earth completely froze over when it usually self regulates itself  through natural feedbacks/variations.
  • Was there something that you learned this week that prompted you to do your own research?
Understanding tree growth and photosynthesis as this is something I hadn't touched on for a long time also the understanding behind the snowball earth.